
Growth is growth. But a developing nation of 146 crore people is not a one-theme market.
The comparison doing the rounds is simple. S&P 500 EPS grew ~53% in April–June 2026. The Nifty managed 13–25%. So capital goes to America.
Yes, earnings growth is earnings growth. A rupee of profit and a dollar of profit both count. If we compare only growth rates, the comparison stands. But the moment part of that growth is circular, the two numbers stop being comparable. To see why, look at how the US number was made, and at who India has been compared with before.
India has always been compared with someone
A few years ago it was Korea, Brazil, Indonesia and South Africa. Today it is the US. Look at what those markets have in common: a handful of companies, often one theme, carrying the whole index.
Korea’s market leans on two memory-chip makers, Samsung and SK Hynix, at ~40% of the index. When doubts over the memory cycle hit in mid-2026, the KOSPI fell ~27% in under a month. Indonesia’s index, heavy with a few banks and conglomerates, lost ~35% in six months on doubts about free float and disclosure. Brazil fell ~14% in a single session on 26 October after its election. South Africa leans on one tech holding group for about a quarter of its market. Annexure F
The triggers differ: memory chips, governance, politics. The weakness is the same. When a market rests on a few pillars, one crack shakes the whole building.
How the US number was made
Out of 500 companies, the profit engine is one idea: AI. 21 AI-linked companies hold ~34% of the S&P 500’s value and earn ~38% of its profit. Annexure A That is not 500 companies growing together. It is one theme carrying the index, which is exactly the Korea pattern on a bigger stage.
Inside that theme, four Big Tech firms sit in a web of deals with the AI start-ups. Annexure B Strip away the press releases and there are only three ways it lifts their EPS:
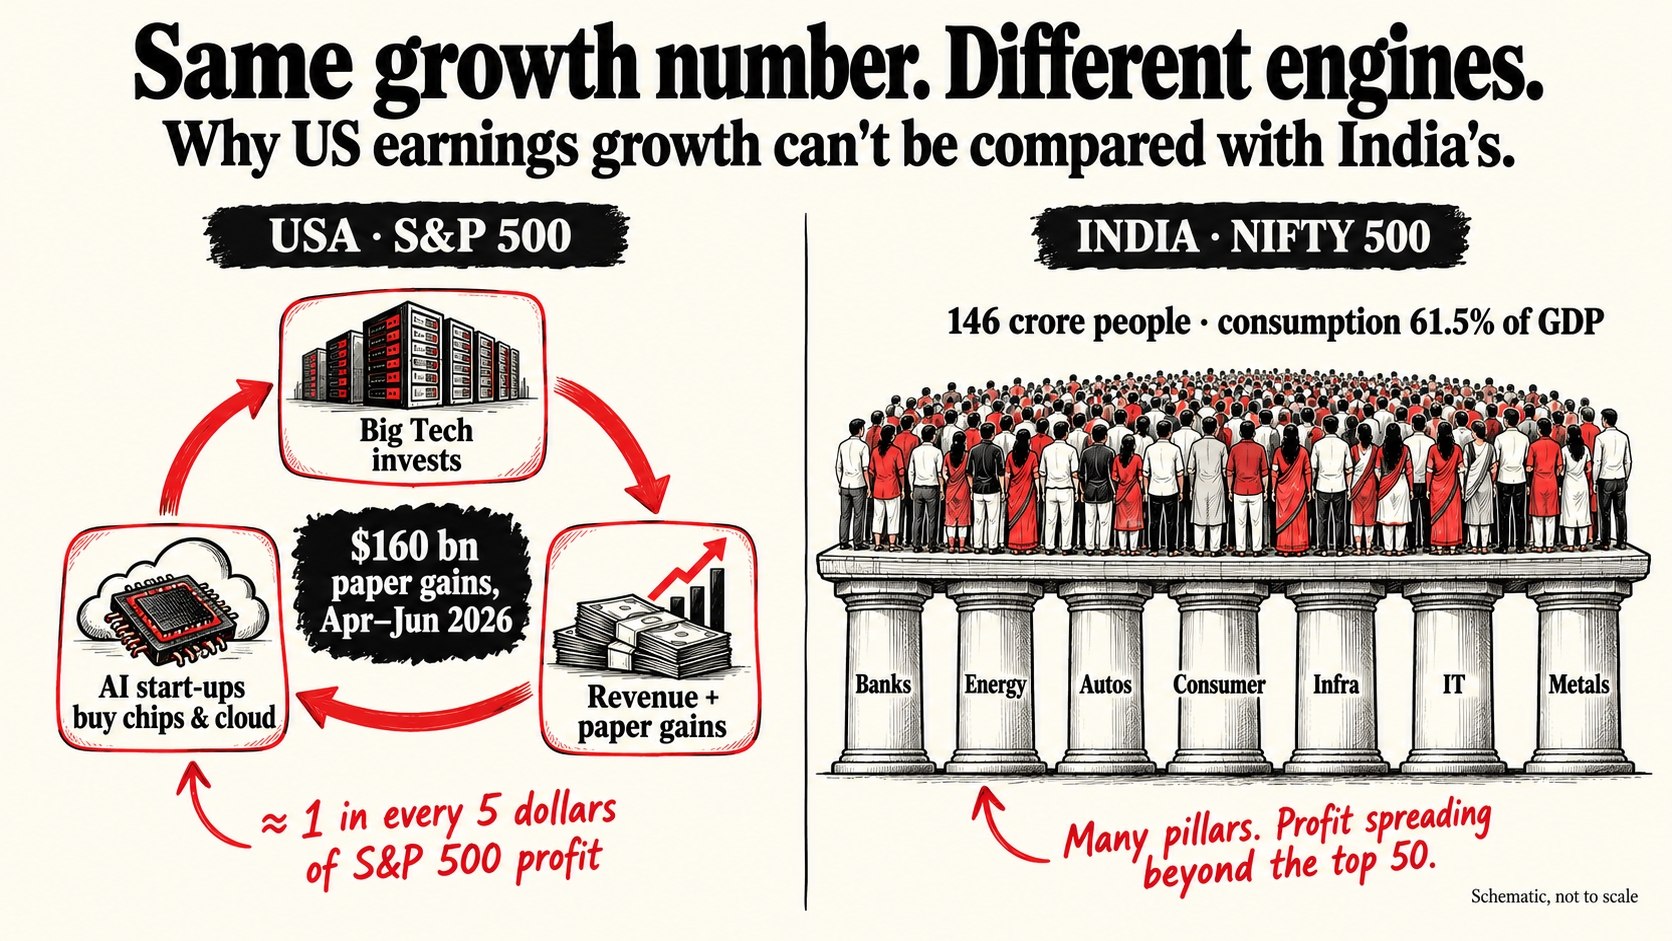
Now do the division. In April–June 2026, ~$160 bn of Big Tech profit was paper gains on AI stakes, against roughly $864 bn of total S&P 500 profit. That is about 1 in every 5 dollars. Annexure C Not all US EPS is propped up. But a meaningful slice is, and it sits inside the companies that carry a third of the index.
The cracks are already showing
We are not saying the US market will fall or rise. But the AI trade is starting to wobble, and the wobble begins exactly where the paper gains were.
This week Alphabet reported its July–September results. Profit fell 25%. The same investment book that produced huge gains in April–June produced an $8.7 bn loss. Capital spending jumped to $51.4 bn, more than the cash the business generated. The share had its worst day on record. Annexure E
The next morning, Amazon and Intel flagged heavy cash burn, Nasdaq futures dropped about 2.5%, and the Nasdaq closed October down more than 5%. The market is now asking a simple question: show us the revenue.
That is the second lever running in reverse. Paper gains lift EPS on the way up. Paper losses cut it on the way down.
Who wins, and who pays
The winners today are the sellers of chips and cloud. Their order books are real and full. The payers are the AI model makers at the end of the loop. Their spending becomes everyone else’s revenue, and they are not yet earning it back.
Big Tech plans $660–690 bn of AI capex in 2026. The largest AI model maker lost more than it earned last year. Annexure D If their revenue catches up, the loop holds. If not, valuations fall and orders slow.
India is a different economy
India is the world’s most populous nation, and still developing. It has ~146 crore people, consumption at 61.5% of GDP, and income per person roughly one-thirtieth of America’s. Annexure H
That gap is the growth engine. Profits here come from first home loans, first two-wheelers, insurance policies, power connections and highways. Banks fund it, energy and metals feed it, autos and consumer companies sell into it. Services exports and a large, young, skilled workforce add to it. None of it depends on companies billing each other.
And the profit base is widening. The Nifty 50’s share of Nifty 500 profit fell from 87% to 51%, and mid- and small-caps delivered about two-thirds of FY26 profit growth. Annexure I
To be fair to both sides
US earnings are not fake. The other 493 companies also grew strongly, the chip and cloud sales are real, and the paper gains are legal and disclosed.
India is concentrated too, mainly in banks. Annexure G But banks lending to a growing economy is a very different risk from companies funding each other’s customers. And India has had its own bad year in some large stocks. A broad market does not mean a market that never falls.
What to watch
- Investment gains and losses in Big Tech results. If they keep swinging profit, earnings quality has not improved.
- Proof of AI revenue. The loop holds only if end-users start earning what they spend.
- The big AI listings. Public prices will test the private valuations behind last quarter’s gains.
- India’s FY27 earnings. Broad credit and consumption growth must show up in the numbers.
Annexures
Data referred to in the article. Tap any “Annexure” link above to jump here.
Annexure A · AI-linked companies in the S&P 500
| Company | Value % | Cum. | Profit % | Cum. |
|---|---|---|---|---|
| NVIDIA | 7.85% | 7.85% | 7.34% | 7.34% |
| Microsoft | 5.96% | 13.81% | 5.42% | 12.76% |
| Alphabet | 4.51% | 18.32% | 8.97% | 21.73% |
| Amazon | 3.59% | 21.91% | 5.13% | 26.86% |
| Broadcom | 2.47% | 24.38% | 1.44% | 28.30% |
| Meta | 2.08% | 26.46% | 2.85% | 31.15% |
| Micron | 1.59% | 28.05% | 3.23% | 34.38% |
| AMD | 1.39% | 29.44% | 0.24% | 34.62% |
| Palantir | 0.67% | 30.11% | 0.11% | 34.73% |
| Intel | 0.65% | 30.76% | Loss | 34.73% |
| Oracle | 0.60% | 31.36% | 0.72% | 35.45% |
| Applied Materials | 0.50% | 31.86% | 0.35% | 35.80% |
| Lam Research | 0.48% | 32.34% | 0.32% | 36.12% |
| KLA | 0.33% | 32.67% | 0.20% | 36.32% |
| Sandisk | 0.30% | 32.97% | 0.42% | 36.74% |
| Marvell | 0.29% | 33.26% | 0.10% | 36.84% |
| Arista Networks | 0.28% | 33.54% | 0.15% | 36.99% |
| Seagate | 0.24% | 33.78% | 0.17% | 37.16% |
| Dell | 0.21% | 33.99% | 0.42% | 37.58% |
| Western Digital | 0.20% | 34.19% | 0.38% | 37.96% |
| Vertiv | 0.14% | 34.33% | 0.08% | 38.04% |
| Total (21 companies) | 34.3% | 38.0% |
Market value as of 29 Oct 2026. Intel made a net loss over the last 12 months.
Annexure B · The AI deal loop
| Investor / seller | Money going out | AI company | Money coming back |
|---|---|---|---|
| Microsoft | ~$19 bn invested since 2019 | OpenAI | ~$250 bn Azure cloud commitment |
| Microsoft | Up to $5 bn | Anthropic | $30 bn Azure cloud commitment |
| NVIDIA | Up to $100 bn | OpenAI | Purchases of NVIDIA chips |
| NVIDIA | Up to $10 bn | Anthropic | Use of NVIDIA systems |
| NVIDIA | ~7% stake + $6.3 bn deal | CoreWeave | Purchases of NVIDIA systems |
| Amazon | $8 bn (2024) + $5 bn, up to $20 bn more (2026) | Anthropic | ~$100 bn AWS compute over a decade |
| Alphabet | $10 bn, up to $30 bn more (2026), ~14% stake | Anthropic | Up to 5 GW of Google TPUs over five years |
| Amazon (AWS) | — | OpenAI | $38 bn AWS deal over seven years |
| Oracle | ~$40 bn of NVIDIA chips | OpenAI | Data-center capacity for OpenAI |
| OpenAI | Chip purchases | AMD | Right to take up to 10% of AMD |
Annexure C · Paper gains inside Big Tech profit, Apr–Jun 2026
| Item | $ bn |
|---|---|
| Alphabet: other income (mainly SpaceX, Anthropic stakes) | 97.9 |
| Amazon: non-operating income (mainly Anthropic stake) | 53.4 |
| Microsoft + NVIDIA: gains on stakes (combined, approx.) | 8.7 |
| Four companies: total “other income” from AI stakes | 160+ |
| Same four companies, Jan–Mar 2026 | 69 |
| Magnificent 7: total net profit | 315.6 |
| Magnificent 7: of which investment gains | 134.6 |
| Magnificent 7: share from investment gains | ~42% |
| S&P 500: total quarterly profit (approx.) | 864 |
| AI-stake gains as share of S&P 500 profit (approx.) | ~18% |
Annexure D · AI spending vs AI earnings
| Item | Figure |
|---|---|
| 2026 capex plans: Amazon, Alphabet, Meta, Microsoft, Oracle | $660–690 bn |
| OpenAI revenue, 2025 | $13.1 bn |
| OpenAI operating loss, 2025 | $20.9 bn |
| OpenAI revenue, Apr–Jun 2026 | $6.7 bn |
| OpenAI operating loss, Apr–Jun 2026 | $12.3 bn |
| OpenAI planned compute spend, 2026–30 | ~$856 bn |
| Anthropic revenue, Jul–Sep 2026 | $16.8 bn |
| Anthropic net loss, Jan–Jun 2026 (incl. $72.4 bn non-cash charge) | $80.7 bn |
| Anthropic valuation, Apr 2026 → Aug 2026 IPO target | $350 bn → ~$965 bn |
Annexure E · Cracks in the AI trade, October 2026
| Item | Figure |
|---|---|
| Alphabet net income, Jul–Sep 2026 | $26.2 bn (−25%) |
| Alphabet loss on equity investments, Jul–Sep 2026 | $8.7 bn |
| Alphabet capex, Jul–Sep 2026 | $51.4 bn (+114%) |
| Alphabet free cash flow, Jul–Sep 2026 | −$9.1 bn |
| Alphabet share price, 29 Oct 2026 session | −12.6% |
| Nasdaq 100 futures, morning of 30 Oct 2026 | ~−2.5% |
| Nasdaq Composite, October 2026 | −5%+ |
| Nasdaq Composite, 16 Oct 2026 | −2.1% |
| CoreWeave, 16 Oct 2026 | −12% |
Annexure F · Markets India used to be compared with
| Market | Concentration | 2026 fall | Period |
|---|---|---|---|
| South Korea | Samsung + SK Hynix ~40% of index | −27% | 19 Jun – 13 Jul 2026 |
| Indonesia | Heavyweight banks & conglomerates | −34.7% | Jan – Jun 2026 |
| Brazil | Large oil & mining weight | −13.9% | One session, 26 Oct 2026 |
| South Africa | One tech holding group ~25% | — | — |
Annexure G · Concentration side by side
| Measure | S&P 500 | Nifty 50 | Nifty 500 |
|---|---|---|---|
| Top 10 stocks’ share of index | ~39% | ~52% | ~29% |
| Largest block by index weight | Tech ~38% |
Financials ~36% |
Financials ~31% |
| Largest block by profit | AI-linked ~38% |
Financials ~37% |
Financials ~38% |
| Latest annual / quarterly profit growth | 29% (Jul–Sep 26) |
9.1% (FY26) |
15.4% (FY26) |
Annexure H · India and the US: the economy behind the index
| Item | India | US |
|---|---|---|
| Population | ~146 crore | ~35 crore |
| Private consumption, % of GDP | 61.5% (FY26) | ~68% |
| Income per person (approx.) | ~$2,900 | ~$90,000 |
| Median age (approx.) | ~29 years | ~39 years |
Annexure I · Nifty 500: where profit comes from
| Item | Figure |
|---|---|
| Profit share: banking, financial services & insurance (FY26) | 37% |
| Profit share: oil & gas (FY26) | 13% |
| Profit share: automobiles (FY26) | 10% |
| Profit share: metals (FY26) | 8% |
| Profit share: technology (FY26) | 8% |
| Profit share: all other sectors (FY26) | 24% |
| Nifty 500 total profit, FY20 | ₹3.97 lakh crore |
| Nifty 500 total profit, FY26 | ₹18.1 lakh crore |
| Nifty 500 profit growth, FY26 | 15.4% |
| Nifty 50 profit growth, FY26 | 9.1% |
| Nifty 50 share of Nifty 500 profit, FY18 → FY26 | 87% → 51% |
| Mid + small-cap share of FY26 profit growth | ~2/3 |
| Listed (Nifty 500) profit as % of GDP, FY26 | 5.2% |
| Nifty earnings growth forecast, FY27 | 15–16% |